
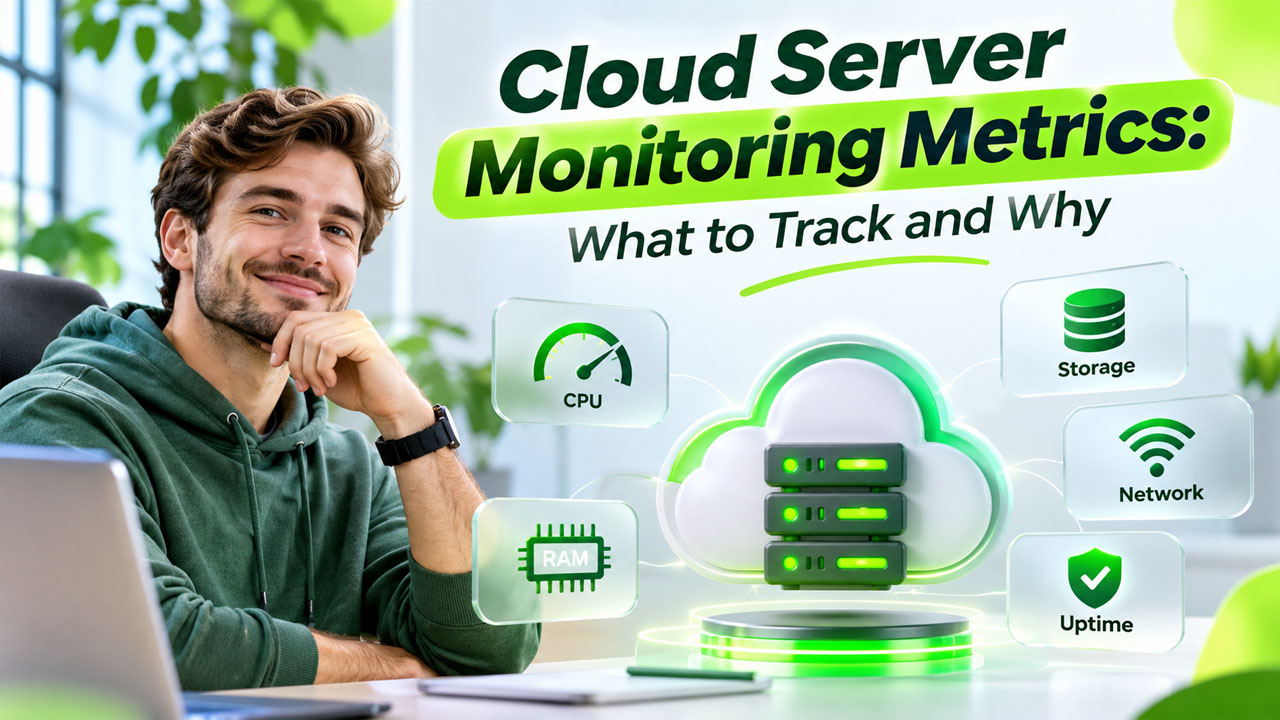
Cloud Server Monitoring Metrics: What to Track and Why
Learn which server monitoring metrics matter most, from CPU and memory to storage, network, uptime & application response times, to maintain cloud performance.
A cloud server can remain online while quietly developing problems that affect application speed, database operations, or customer access. A website may load slowly, an API may take longer to respond, or a scheduled process may stop completing on time. Checking whether a server is online will not necessarily reveal the cause.
This is where server monitoring becomes essential. It gives IT teams visibility into resource consumption, workload behavior, availability, and potential performance issues before they become larger operational problems.
However, collecting every available metric is not the goal. Businesses need to identify the measurements that explain how their infrastructure behaves and which changes require attention. Understanding the right cloud monitoring metrics helps teams make informed decisions about performance, capacity, and reliability.
1. CPU Utilization: Is Your Server Handling Its Workload?
CPU utilization measures how much processing capacity a server is using. It is one of the first indicators administrators examine when investigating slow applications or overloaded virtual machines. Effective server performance monitoring helps administrators assess processor usage, identify resource bottlenecks, and maintain reliable application performance.
A consistently high CPU reading may indicate:
- Too many simultaneous application requests.
- Inefficient database queries.
- Background processes consuming excessive resources.
- Insufficient computing capacity for current workloads.
For example, an e-commerce application may experience increased traffic during a promotional campaign. If CPU consumption remains elevated, checkout requests could take longer to process.
Effective server monitoring should examine CPU trends rather than treating every temporary spike as an incident. Compare average utilization, peak usage, and system load over relevant periods.
2. Memory Consumption: Identify Resource Pressure Early
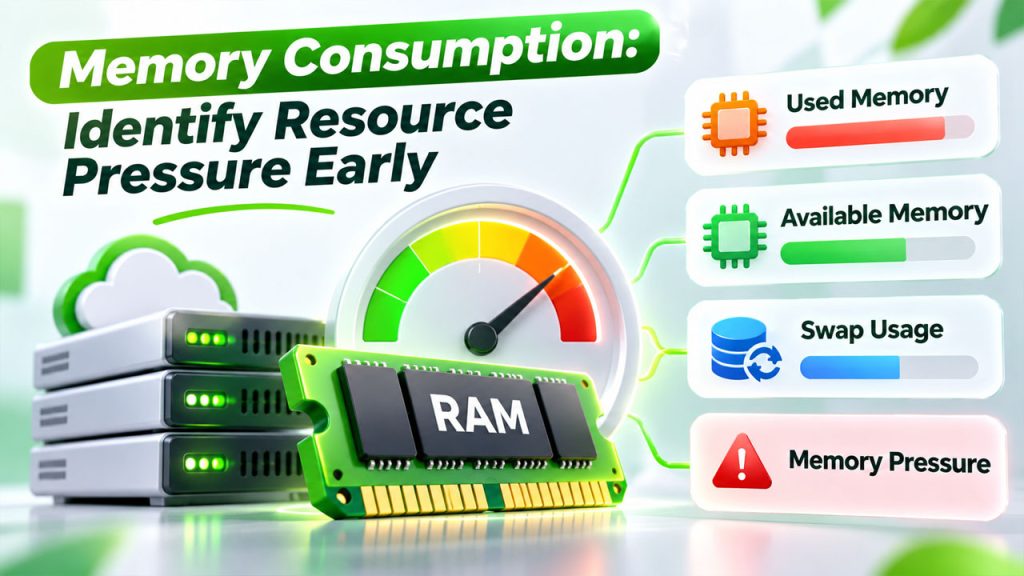
Memory supports running applications, operating system processes, databases, and temporary operations. When available memory becomes insufficient, systems may rely more heavily on swap space or experience process interruptions.
Important memory indicators include:
- Used memory: RAM currently occupied by processes and system operations.
- Available memory: Memory that can be allocated when applications need it.
- Swap usage: Disk space being used as an extension of physical memory.
- Memory pressure: Evidence that the system is struggling to satisfy memory demands.
A database server experiencing growing memory pressure might respond more slowly even when CPU utilization appears normal.
Server health monitoring should therefore consider available memory and swap activity together. High memory usage alone does not always indicate a problem because operating systems also use RAM for caching. Administrators can use Linux memory monitoring commands to check RAM utilization, review system resource statistics, and investigate potential memory constraints.
3. Disk Capacity and I/O: Watch Both Space and Speed
Storage problems are not limited to running out of disk space. A server may have sufficient capacity but still struggle because storage operations are taking too long.
Two categories deserve attention.
Disk capacity metrics
- Total storage capacity.
- Used and available space.
- Filesystem utilization.
- Inode availability, where applicable.
Disk performance metrics
- Read and write operations per second (IOPS).
- Disk throughput.
- I/O latency.
- Queue depth.
Consider an application that stores customer records and generates daily reports. If database storage becomes overloaded, queries may slow down even though the server has plenty of free storage.
Server performance monitoring should track both storage growth and operational activity. Capacity alerts should provide enough warning for administrators to investigate before a filesystem becomes full.
4. Network Traffic: Understand Communication Between Systems
Cloud applications depend on communication between servers, databases, APIs, users, and external services. Network metrics help determine whether connectivity or traffic patterns are affecting application behavior.
The most useful measurements include:
| Metric | What It Reveals |
| Incoming traffic | Data received by the server |
| Outgoing traffic | Data transmitted from the server |
| Network throughput | Volume of data transferred over time |
| Packet loss | Packets that fail to reach their destination |
| Network errors | Communication problems at the interface |
| Connection count | Number of active network connections |
For instance, an application may experience delayed responses because its database connection is congested rather than because the application server lacks CPU capacity.
Infrastructure monitoring becomes more effective when network information is evaluated alongside application and server measurements.
5. Uptime and Availability: Can Users Reach Your Services?
Uptime measures how long a server or service remains operational. Availability evaluates whether users can access the service when required. Businesses can use server health monitoring tools to monitor server status, track critical resource usage, and identify performance issues that could affect service availability.
These measurements are related but not identical. A virtual machine may be running while its web server process has stopped responding.
Track:
- Server uptime and restart events.
- Service availability.
- Failed health checks.
- Application endpoint response status.
- Unexpected shutdowns and recovery events.
For meaningful server monitoring, test important services from an external location rather than relying exclusively on the server’s internal status.
A successful operating-system health check does not prove that customers can complete a login, submit a form, or retrieve application data.
6. Application Response Time and Error Rates
Related walkthrough
Share your local server on public web address | Local Host | Ngrok

Infrastructure metrics explain how resources are behaving, but application-level measurements reveal what users actually experience.
Useful indicators include:
- Average response time.
- 95th and 99th percentile response times.
- HTTP error rates.
- Failed database requests.
- API request duration.
- Application process availability.
Suppose an API normally responds within a few hundred milliseconds but begins taking several seconds. CPU and memory might still appear healthy. The underlying issue could involve a slow database query, an external API dependency, or network delays.
Combining application measurements with server monitoring helps teams investigate the complete request path instead of focusing on hardware alone.
7. Security and System Events: Monitor Unexpected Changes
Performance is only one part of server health. Unusual system activity can also indicate configuration errors, unauthorized access attempts, or unexpected changes.
Useful signals include:
- Repeated failed login attempts.
- Unexpected service restarts.
- Unusual outbound traffic.
- Changes to critical configuration files.
- Unexpected processes or privileged activity.
- Resource consumption outside normal operating patterns.
These indicators should complement dedicated security controls, access management, and log analysis. They do not replace vulnerability assessments or intrusion detection systems.
8. How to Build a Useful Cloud Monitoring Dashboard
A monitoring dashboard should help an administrator answer three questions: Is the service working? Is its performance deteriorating? What needs investigation?
A practical implementation process looks like this:
Step 1: Map your infrastructure
List production servers, virtual machines, databases, application services, storage resources, and important dependencies. Include workloads hosted across different cloud providers.
Step 2: Establish performance baselines
Observe normal resource consumption during typical business hours and peak traffic periods. Different workloads require different thresholds, so avoid applying identical limits to every server.
Step 3: Configure meaningful alerts
Create alerts for sustained CPU pressure, low available memory, rapidly declining disk space, increasing response times, and repeated service failures.
Step 4: Connect metrics with logs
Metrics show when something changed. Logs help explain what happened. Reviewing both together can make troubleshooting more efficient.
Step 5: Review trends regularly
Use historical information to identify resource growth, recurring bottlenecks, and capacity requirements. Update monitoring rules when applications or infrastructure change.
Benefits and Challenges of Consistent Server Monitoring
A well-planned monitoring process offers several operational advantages:
Earlier Issue Detection
Teams can investigate performance deterioration before it becomes a major disruption.
Better Capacity Planning
Historical measurements help estimate future resource requirements.
Improved Troubleshooting
Related metrics make it easier to narrow down potential causes.
Resource Optimization
Administrators can identify consistently underused or overloaded resources.
Greater Service Visibility
Teams gain a clearer understanding of infrastructure behavior.
There are also challenges. Monitoring too many metrics can create unnecessary noise, while poorly configured alerts may cause administrators to overlook important warnings. Cloud environments can also require separate configurations for host-level and guest operating-system measurements. Using automated server health monitoring can help businesses track critical performance indicators, configure timely alerts, and identify potential issues before they affect service availability.
The solution is to monitor business-critical services first, establish workload-specific baselines, and refine alerts as the environment evolves.
Practical Tips for Better Cloud Monitoring
Before finalizing your monitoring strategy, consider these recommendations:
- Prioritize production workloads and customer-facing applications.
- Monitor CPU, memory, storage, network, and service availability together.
- Use sustained thresholds instead of reacting to every temporary spike.
- Monitor application response times alongside infrastructure resources.
- Keep monitoring agents and integrations properly configured and updated.
- Review alert history to remove recurring false positives.
- Test notification delivery and incident escalation procedures.
- Retain historical data long enough to identify meaningful performance trends.
For businesses operating across AWS and Azure, monitoring configurations should account for differences in available platform and guest-level metrics. A centralized multi-cloud infrastructure monitoring solution can help administrators track cloud performance, monitor resource utilization, and maintain visibility across both environments.
Conclusion
Reliable cloud infrastructure depends on more than keeping virtual machines switched on. Administrators need to understand resource utilization, storage behavior, network activity, application responsiveness, and unexpected system events.
A structured server monitoring strategy connects these measurements and turns raw infrastructure data into actionable information. Rather than waiting for users to report slow applications or unavailable services, teams can identify warning signs, investigate their causes, and plan infrastructure improvements.
OutRight Systems provides cloud-related solutions covering AWS, Microsoft Azure, CRM hosting, and infrastructure requirements. Businesses evaluating their cloud architecture can explore these services to identify an approach that aligns with their technical and operational needs.
Frequently Asked Questions
The main metrics include CPU utilization, memory availability, disk capacity, disk I/O, network throughput, uptime, application response time, and error rates. The exact priorities depend on the workload.
Collection frequency depends on the importance of the workload and the metric being measured. Critical production environments often require frequent collection, while some capacity-planning measurements can be reviewed over longer intervals.
Server monitoring focuses primarily on individual server health and performance. Infrastructure monitoring has a broader scope that includes servers, networks, storage, virtual machines, and cloud resources.
Yes. A server can respond to basic availability checks while experiencing high resource pressure, slow storage operations, network problems, or application errors.
Alerts notify administrators when measurements cross defined conditions or when important services become unavailable. Properly configured alerts help teams investigate issues without constantly checking dashboards manually.