


Picture this: you've just pulled together a dataset on customer purchase amounts. You open your visualization tool, pick a bar graph, and present it to your team. It looks clean
Picture this: you've just pulled together a dataset on customer purchase amounts. You open your visualization tool, pick a bar graph, and present it to your team. It looks clean and professional, but something feels off, and you can’t quite recognize it. Here's what went wrong: you used the right tool for the wrong job.
This happens more than most people admit. Histogram VS bar graph look nearly identical on the surface: both use rectangular bars, both sit on an x and y axis, but they communicate entirely different things. Mixing them up isn’t just a cosmetic error; rather, it changes how data is interpreted, and that matters in professional or analytical settings. The real distinction between a histogram and a bar graph isn’t just visual; it’s conceptual. It starts with understanding what type of data you have and what story you’re trying to tell with it. Once you get that right, choosing the correct chart becomes obvious.
What Is a Bar Graph? Definition, Features, and Uses
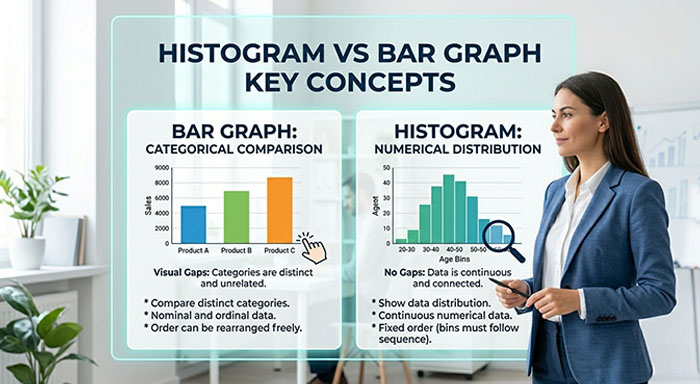
A bar graph is also known as a bar chart or column chart. It uses rectangular bars to display categorical data. Each bar represents a distinct category, and the height or length of the bar reflects the value associated with that category.
Suppose you want to compare monthly sales across different product lines or track cores of customer satisfaction across five cities. These are separate, unrelated categories, and bar graphs are perfect for handling these.
Key Features of Bar Graphs Explained:
- Bars represent distinct and separate categories without requiring any natural order
- Visual gaps between bars signal that categories are independent of each other
- It works for both nominal data (names, labels) and ordinal data (ranked categories)
- It can be displayed both vertically and horizontally
- It is easy to understand and make sense of data
Bar graphs are incredibly versatile. They are used in academic presentations, business reports, marketing dashboards, and everyday data storytelling. Their strength lies in comparison. They place categories side by side to make differences stand out immediately and clearly.
What Is a Histogram? Definition, Features, and Examples
A histogram is a chart that displays the distribution of numerical data by grouping values into ranges called bins or intervals. It does not compare categories; rather, it shows how often different values occur.
Imagine you're analyzing the ages of users who signed up for your app. You don't just want to know how many users are of age 25; rather, you want to understand the overall distribution of age. Are most users between 18 and 30? Is there a spike at 40? A histogram reveals that shape instantly.
Key Features of a Histogram Explained:
- Bars represent continuous numerical ranges, not separate categories
- No gaps between bars signal that the data is connected and continuous
- The x-axis shows intervals or bins, not individual labels
- Bar width can vary depending on the size of each interval
- It reveals patterns like skewness, peaks, and spread in data distribution
Histograms are used in statistics, quality control, data science, and research. They don’t just reveal values; they show the shape of your data to tell a deeper story that raw numbers could never do.
Histogram vs Bar Graph: Key Differences Explained
This is where most confusion lives. Here's a clean side-by-side breakdown:
| Yes, bars are separated | Bar Graph | No, bars touch each other |
|---|---|---|
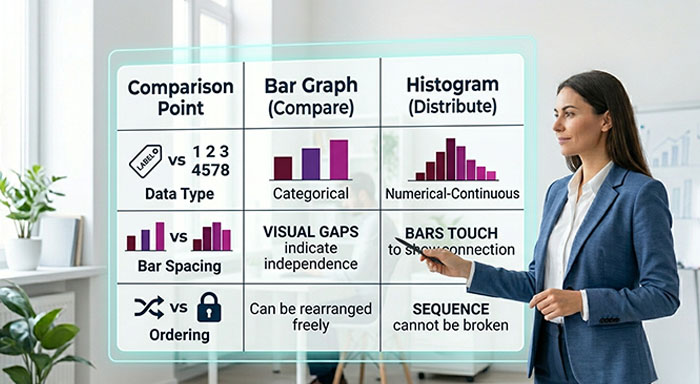
| Data Type | Categorical | Numerical/Continuous |
| X-Axis | Categories or labels | Ranges/ Intervals (bins) |
| Bar Gaps | Yes; bars are separated | No; bars touch each other |
| Purpose | Compare distinct groups s | Show data distribution |
| Order of Bars | Can be rearranged freely | Cannot be rearranged |
| Bar Width | Usually equal, decorative | Width can carry meaning |
| Best Used For | Sales, surveys, rankings | Age, frequency, scores |
The single most important distinction: bar graphs compare; histograms distribute.
In a bar graph, you can shuffle the bars around, and the chart still makes complete sense. In a histogram, the order is fixed because the intervals follow a numeric sequence. Rearranging them would make the chart meaningless. That one detail, that is reorderability, is a surprisingly reliable test when you're unsure which chart to use.
Histogram vs Bar Graph: When to Use Each Chart
Are you still unsure which one fits your data? Use this as your decision guide:
Use a bar graph when:
- Your data falls into named categories such as cities, products, departments, and months
- You want to compare values across distinct groups side by side
- Your audience needs a chart that's instantly readable without a statistical background
- You're working with survey results, rankings, or grouped counts by label
- The categories have no inherent numeric relationship to each other
Use a histogram when:
- Your data is numerical and continuous, such as ages, temperatures, test scores, and prices
- You want to understand how data is distributed across a range
- You need to spot outliers, clusters, or skewed patterns in large datasets
- You're working in statistics, research, or data analysis
- The frequency or density of values within ranges matters more than individual counts
A simple rule of thumb: if you can clearly label each bar with a name or category, use a bar graph. If your bars represent number ranges and removing one would break the sequence, use a histogram.
Common Histogram vs Bar Graph Mistakes to Avoid
Even experienced analysts slip up here. Watch out for these common mistakes:
- Histogram Gaps Mistake: It signals categorical data and breaks the visual logic of continuity. When bars in a histogram are separated, readers instinctively treat each bar as an independent category, completely losing the sense that the data flows across a continuous range.
- Bar Graph Gap Removal Error: Makes it look like a histogram and confuses the reader. Touching bars implies that the categories are connected or sequential, which misrepresents the data and leads to incorrect interpretations.
- Using a bar graph instead of a histogram: Loses the distribution pattern entirely. A bar graph can tell you individual values per category, but it cannot reveal whether your data is skewed, clustered, or normally distributed. These insights can only be shown by histograms.
- Wrong Histogram Bin Size Selection: Too few bins hide patterns, while too many create noise. The right bin size is what reveals the true shape of your data. If the size is too wide, you miss peaks, and if it's too narrow, every tiny fluctuation looks like a meaningful trend.
- Confusing Histogram vs Bar Graph: They don't; one compares while the other distributes. A bar graph answers, "which group has more?", while a histogram answers, "how is this data spread?". Treating them as interchangeable leads to drawing the wrong conclusions from your data entirely.
These mistakes usually come from grabbing the most familiar chart rather than thinking about the data first. Slow down, identify your data type, and the right chart will follow.
How to Choose Between Histogram and Bar Graph
Run through these questions before you build your chart:
Identify Between Continuous vs Categorical Data Type: If the values exist on a spectrum, like age, temperature, income, time, distance, you are almost certainly looking at a histogram situation, much like how promotion analytics tracks sales performance across continuous ranges rather than fixed categories. If the values belong to distinct, nameable groups such as products, regions, candidates, or departments, a bar graph is the right call.
- Choose Between Comparison vs Distribution: If the question is "how do these things compare to each other," use a bar graph. If the question is "how is this data distributed across a range," use a histogram.
- If the question is "how do these things compare to each other," use a bar graph. In marketing strategy, bar graphs compare campaign results across channels while histograms reveal how customer behavior is distributed across a range.
- Check If Data Can Be Reordered: If yes, you are working with a bar graph. If reordering makes the chart nonsensical, you need a histogram.
- Determine Number of Variables: Histograms work with a single continuous variable. Bar graphs work with multiple categories sharing a common metric.
- Analyze Data Shape vs Comparison Needs: Shapes such as skew, peaks, spread, and clusters point to a histogram. When there is a comparison, such as who is highest, who is lowest, what is the gap, it points to a bar graph.
- Understand Bar Spacing and Continuity: If the categories are genuinely separate and distinct, yes. If the values are part of a continuous range, then no, and if not, that is your histogram.
One more thing worth knowing: you can use both on the same dataset, and sometimes you should. Daily sales figures for a year can go into a histogram to show how those numbers are distributed — how many days hit which revenue ranges and where the outliers are. Those same figures, grouped by month and plotted in a bar graph, show seasonal patterns and monthly comparisons. Different questions, different charts, but the same data. Both are valid.
Final thoughts: Histogram vs Bar Graph
Histogram vs bar graph is one of those topics that sounds simple until you realize how often the wrong one gets used and how much it quietly distorts understanding.
The bars may look the same. The axes may feel familiar. But one chart is built for comparison, the other for distribution. One works with labels, the other with ranges. Choosing between them isn't a matter of personal preference or aesthetics; it's a matter of data integrity.
Next time you reach for a chart, pause for one second and ask: Am I comparing categories, or am I revealing how data is spread? That single question will point you to the right answer every time. Good data visualization isn't about making things look good; it's about making sure the right message gets through, clearly and honestly.
Histogram vs Bar Graph FAQs
Q. Can a histogram and a bar graph ever look the same?
Yes, visually they can appear similar, but they represent different data types. A histogram shows continuous numerical ranges while a bar graph shows separate categories.
Q. Is a histogram always vertical?
Mostly yes, but horizontal histograms exist. Vertical is standard because it makes distribution patterns easier to read at a glance.
Q. Can I use a bar graph for numerical data?
A. You can, but only if the numbers represent distinct categories like years or rating scores. For continuous numerical data, a histogram is more appropriate.
Q. What happens if I choose the wrong chart?
A. Your audience may draw incorrect conclusions. A bar graph used for continuous data hides distribution patterns that could be critical for analysis.
Q. Is a Histogram vs Bar Graph relevant only in statistics?
Not at all. This distinction matters in business reporting, marketing analytics, product research, healthcare data, and any field where data needs to be communicated clearly.
Respond to this article with emojis