Top 7 container monitoring tools in 2026
Compare 7 container monitoring tools for 2026, from Netdata to Elastic Observability. Explore key features, costs, and ideal use cases.
Running containers is the easy part now. CNCF in its 2025 Annual Cloud Native Survey published in 2026, stated that 82% of container users operate Kubernetes in production, which is up from 66% from 2023. This showcases what these containers are doing is where the teams are struggling the most.
A pod that keeps the spikes for eight seconds and dies never shows up on a one-minute dashboard. The bill also grows with every new node that can quietly outpace the infrastructure it describes. The blog also ranked seven tools that decide whether monitoring gets used or ignored, which include setup effort, metric resolution, cost model, runtime coverage, and alert quality.
What to look for in a container monitoring tool
Start with setup time. If the tool needs a week of agent turning it before the first useful chart appears, the team will find reason not to finish. Auto-discovery of containers, pods, services, is worth more than a long feature list.
Next, check resolution. The containers are generally short-lived, making per-second metrics catch problems that per-minute averages smooth away. It then looks at the cost model, as it matters more than the stickers price. The per-host, per-node, per-GP-integrated, and per-container pricing behave very differently, once they scale from 20 containers to 2,000.
Also confirm coverage for your actual runtimes (Docker, containerd, Podman, Kubernetes), support for OpenTelemetry and eBPF, and how much alert noise the default rules produce. Finally, be honest about security needs. Some teams need runtime threat detection in the same tool; others handle it elsewhere.
1. Netdata
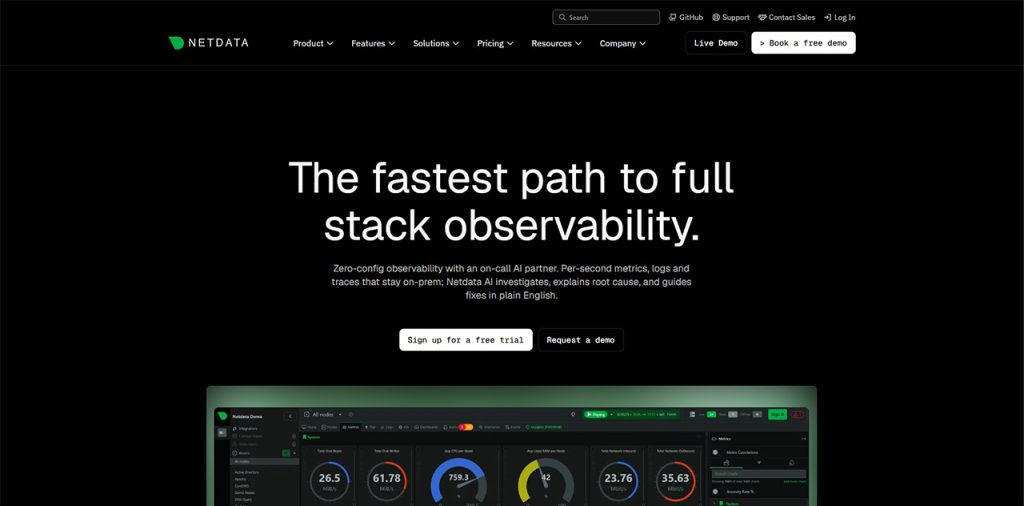
Netdata earns the top spot because it removes the setup tax. According to Netdata, its agent auto-discovers containers and services and produces dashboards and alerts within about a minute, collecting metrics every second. For teams comparing the best container monitoring tools on setup effort alone, that is hard to beat.
Netdata says it covers Kubernetes, Docker, containerd, Podman and LXC/LXD, adds machine-learning anomaly detection per metric, uses eBPF for network visibility and accepts OpenTelemetry traces. Pricing is per node, so it doesn’t grow with the number of containers you run on each one.
Best for lean platform teams and mixed Docker and Kubernetes fleets. The tradeoff: if you need long-term retention, deep governance controls or full APM in a single vendor suite, the larger platforms below go further.
2. Full-stack observability – like Datadog
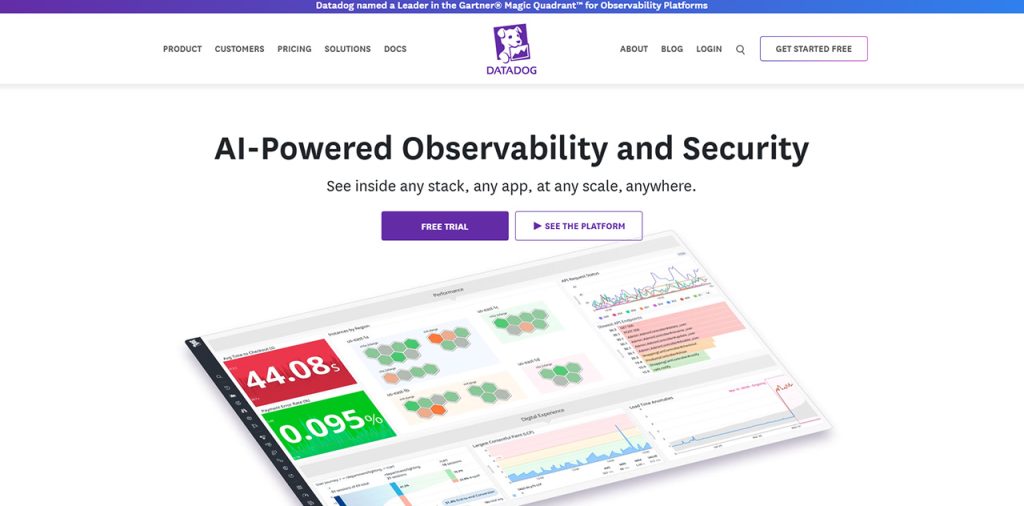
Datadog is the default choice for organizations that want metrics, logs, traces, security and user monitoring under one roof. Its integration catalog is enormous, and container and Kubernetes views are mature.
The catch is cost. Per-host pricing, plus separate charges for add-on products, can climb quickly as your fleet grows, and finance teams tend to notice before engineers do. It suits well-funded teams that value breadth over simplicity. If you’re still mapping your wider toolchain, our overview of DevOps and infrastructure tooling is a useful companion.
3. Automated root cause analysis – like Dynatrace
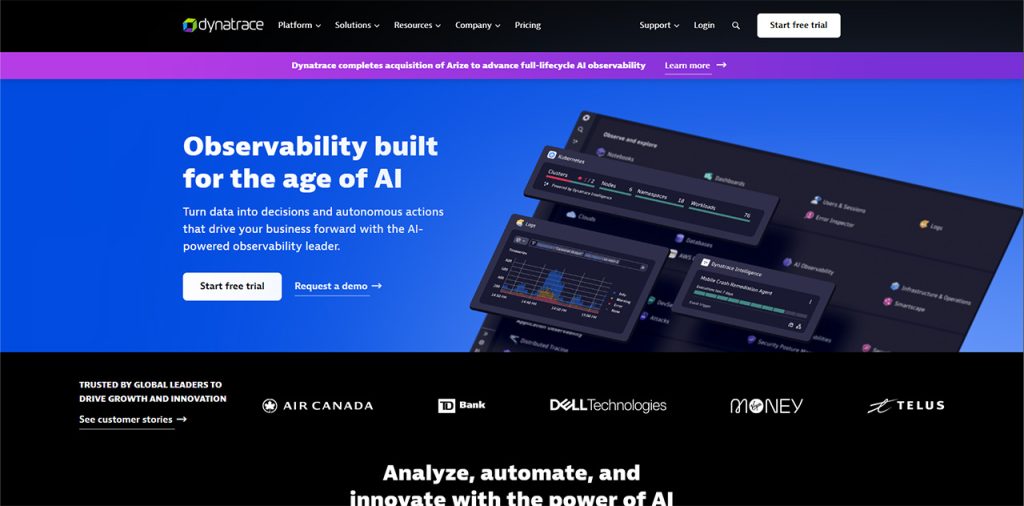
Dynatrace leans on a single agent, automatic topology mapping and an AI engine that points toward probable causes rather than leaving you to correlate alerts by hand. For large estates with complex service dependencies, that automation saves real investigation time.
It’s also an enterprise product, with enterprise pricing and a learning curve to match. PeerSpot’s September 2026 user rankings still place Dynatrace among the top five container monitoring solutions, though its mindshare fell from 33.0% to 21.0%. Strong product, shrinking share; smaller teams may find it more than they need.
4. Runtime security and monitoring – like Sysdig
Related walkthrough
Google Workspace vs Microsoft 365 in 2026 | Full Comparison: Features, AI Tools & Pricing
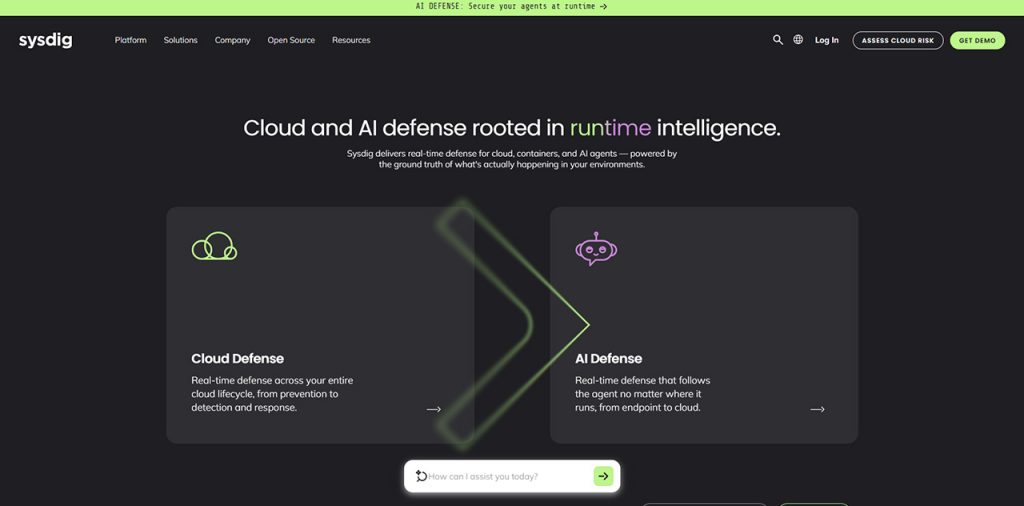
Sysdig started from container security and added monitoring on top, which shows. Runtime threat detection, vulnerability context and compliance reporting are its strengths, and it’s built around how containers actually behave at the kernel level.
Choose it when security teams and platform teams share the same requirements, particularly in regulated environments. If you only want performance dashboards, you’ll be paying for capability you won’t use.
5. Open-source stack – like Grafana and Prometheus
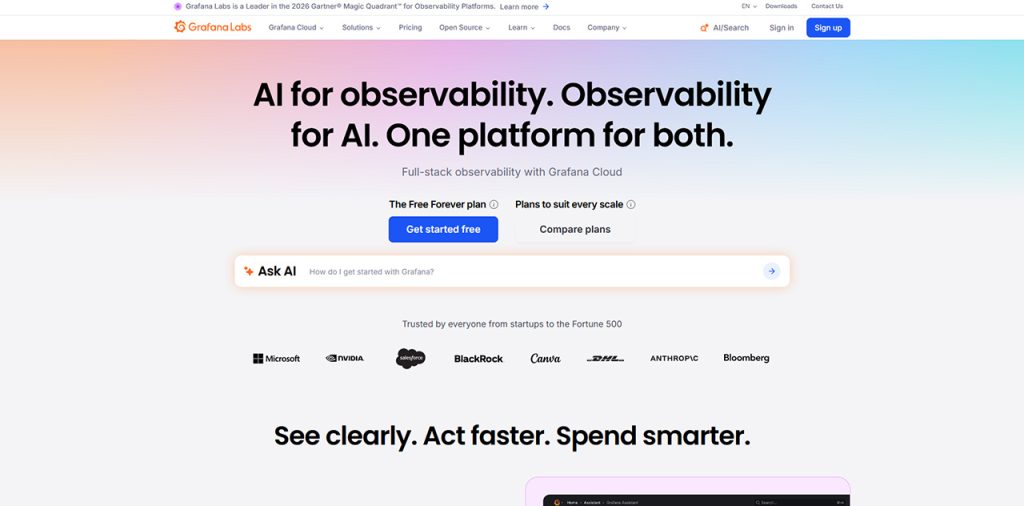
Prometheus for collection, cAdvisor for container metrics and Grafana for dashboards remain the most common open-source combination. You get PromQL, a huge community and complete ownership of your data. The ecosystem is also where much of the industry’s energy sits: the CNCF survey found that OpenTelemetry has more than 24,000 contributors, making it the second-highest-velocity CNCF project.
Free software isn’t free to run. Someone has to scale storage, manage retention, write alert rules and keep the stack upgraded. Teams with strong in-house expertise do well here; teams without it often end up with a dashboard graveyard.
6. Usage-based telemetry – like New Relic
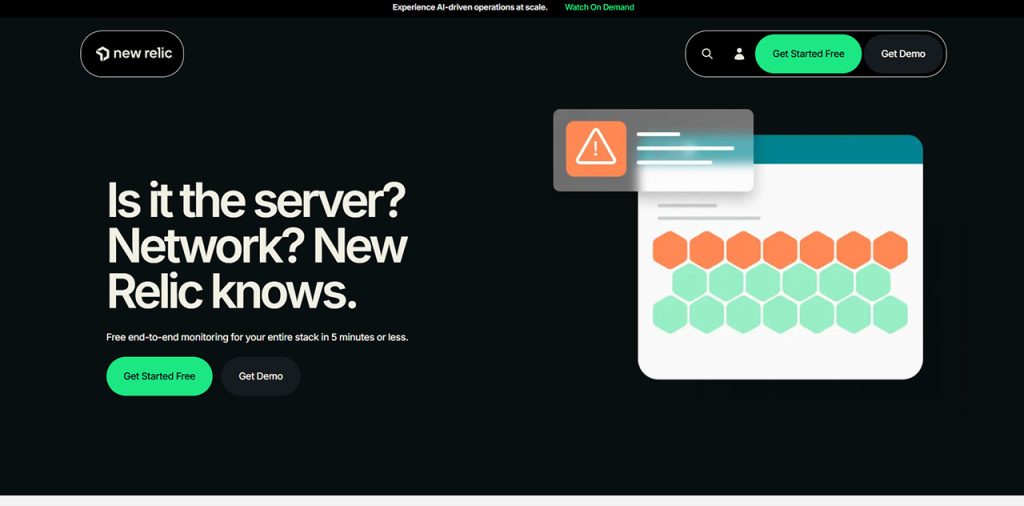
New Relic prices around the volume of data you send rather than the number of hosts. It also offers a free tier, which makes it easy to try. That model works well when your telemetry volume is predictable and you’ve been disciplined about what you ingest.
It works badly when verbose logs or high-cardinality metrics creep in, because the bill follows the data. Set ingest budgets early and review them monthly.
7. Search-first observability – like Elastic Observability
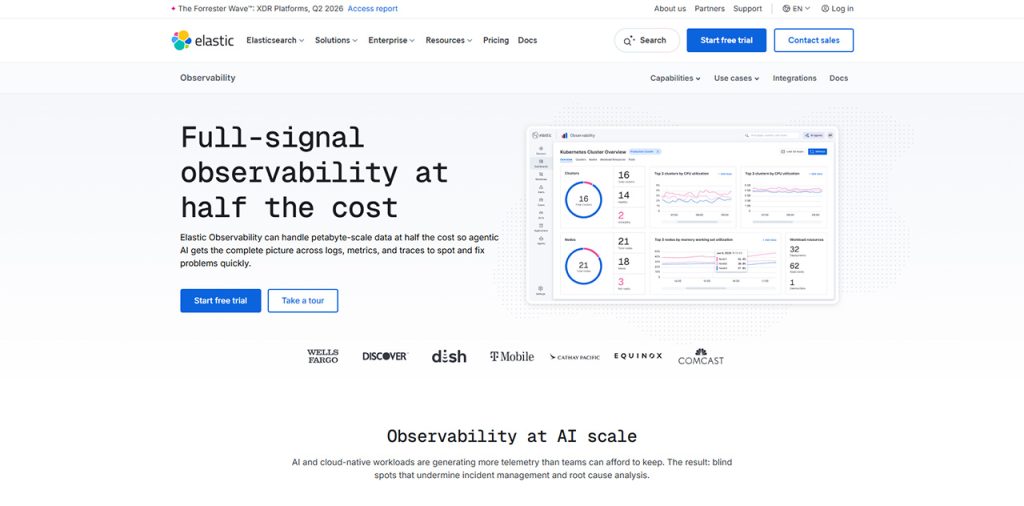
Elastic Observability is log-centric, built on the same search engine many teams already run for other purposes. If your organization already uses Elastic, adding container metrics and traces is a natural extension, and searching across logs is fast and flexible.
Expect more tuning than with the auto-discovering tools above, particularly around index sizing and retention. It rewards teams that already know the stack and frustrates those starting from scratch.
How to choose by team size
Startups and small platform teams should favor the lowest-friction option with per-second visibility, since nobody has time to babysit a monitoring stack. Mid-size teams with mixed workloads can combine a lightweight collector with an existing log platform. Regulated enterprises will usually need runtime security or governance features that push them toward Sysdig, Dynatrace or Datadog. If you run only on AWS, CloudWatch Container Insights is worth a look alongside these seven.
Technology isn’t the only obstacle. The CNCF found that 47% of respondents cite cultural change with development teams as their top challenge, ahead of technical complexity at 34%. A tool that engineers resist will fail regardless of its feature list, so pilot with the people who’ll be on call.
Before committing, review your current setup. Our guide to monitoring evaluation during an infrastructure review covers warning signs that show up well before an outage does.
Conclusion
Start with the tool that gives you per-second visibility with the least effort, and add security or full APM only where a real gap appears. Most teams over-buy at the beginning and under-use what they bought.
If you want help wiring monitoring into a wider platform plan, our team’s work on observability and Kubernetes support is a good place to begin.