
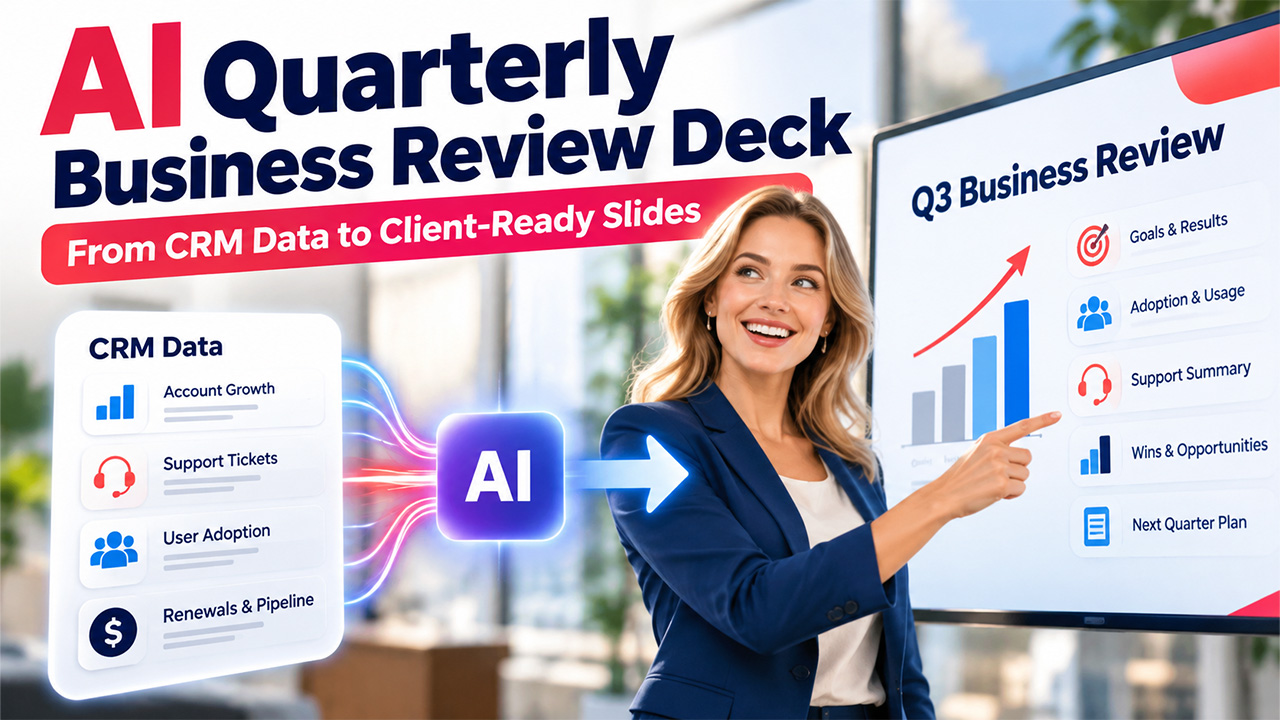
How to Build a Quarterly Business Review Deck With AI
Learn how to build an AI-Powered Quarterly Business Review Deck that can pull the right CRM data and turn notes into a first draft.
Two days before a quarterly business review, most account managers are in the same spot: a CRM export open in one tab, last quarter’s deck open in another, and a calendar invite that says “QBR with client, 60 min” sitting there like a deadline on a fridge. The numbers exist. The story doesn’t yet. And the slides from last quarter still have the old logo on slide 9 because nobody noticed.
I’ve built a lot of these decks, for my own accounts and for other teams, and the slow part has rarely been the data. It’s the translation. You have pipeline reports, ticket counts, renewal dates and usage figures sitting in your CRM, and somebody has to turn that into twelve slides a client’s VP of operations will actually read. AI tools are good at exactly this middle step, and AI in CRM can help teams summarize customer information and organize useful insights, provided you keep the judgment calls for yourself.
Building an effective quarterly business review deck is more than presenting quarterly metrics. It means turning CRM data, customer success milestones, support trends, and account goals into a clear story that helps stakeholders understand progress and agree on the next steps. With AI, account managers can streamline the first draft, organize key insights, and spend more time validating results, and preparing meaningful recommendations.
Start with what the client cares about, not with the export
A QBR deck has one job: show the client that the relationship is producing what they paid for, and agree on what happens next quarter. Everything else is decoration. Before touching any tool, write down three things on a sticky note or in a plain text file:
- The outcome the client bought you for (fewer support tickets, faster quote turnaround, cleaner pipeline data, whatever it was in the original deal).
- The single number that best shows progress on that outcome this quarter.
- The one thing you need from them next quarter.
That third item gets skipped constantly. Teams present a quarter’s worth of activity and then end with “Questions?” instead of a request. If you need a data owner assigned, or budget approved for a second module, or a sponsor to join the next call, put it on the sticky note now.
Pull the right CRM data (and less of it)
Your CRM data can export far more than the meeting needs. For a typical B2B account, I pull these:
- Account health or usage metrics for the quarter, compared with the previous quarter
- Open and closed support cases, with average resolution time
- Any expansion or renewal opportunities and their stage
- Key activities logged: training sessions, onboarding milestones, integrations shipped
- Notes from the last QBR, specifically the commitments made on both sides
The quality of your quarterly business review deck depends on the data you choose to include. Focus on metrics that connect directly to the client’s goals, such as product adoption, support performance, renewal progress, and completed commitments. Summarizing these figures before using AI makes it easier to create slides that highlight meaningful business outcomes instead of overwhelming stakeholders with raw data.
That last item is the one that makes a QBR feel honest. If you promised a custom report in July and it shipped in September, say so. Clients remember what they were promised far better than vendors do.
Export to a spreadsheet, delete the columns nobody will discuss, and then summarise each block in two or three plain sentences. This summary is what you’ll hand the AI. Raw CSVs tend to produce slides full of tables that look busy and say nothing.
How to Create a Quarterly Business Review Deck With AI
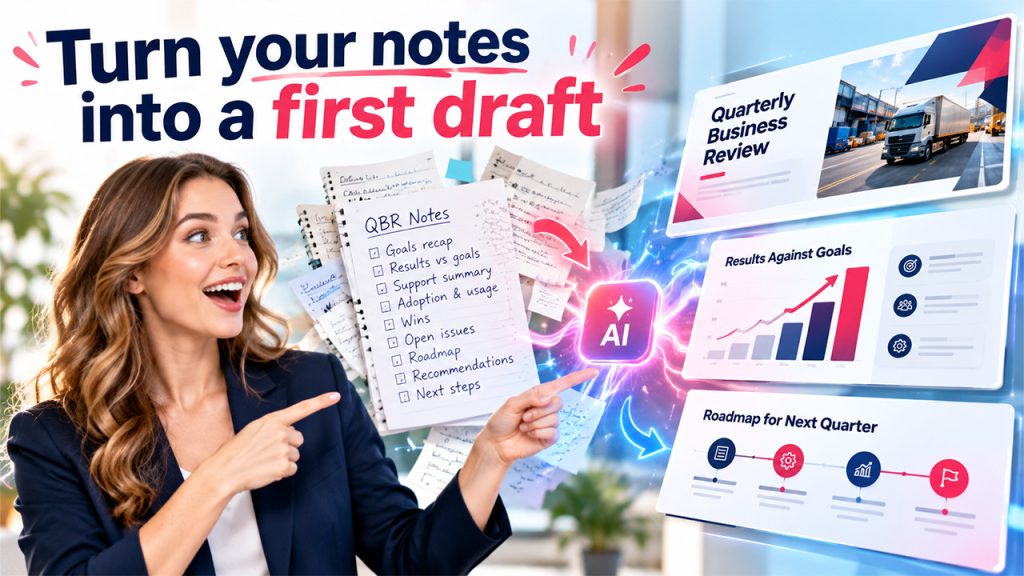
An AI presentation maker can help turn summarized account data into a structured quarterly business review deck. Start by defining the audience, the outcomes you want to demonstrate, and the decisions you need from the client. Then provide your cleaned-up notes and a clear slide outline so the tool can generate an initial draft. Review the content carefully, verify every figure, and rewrite generic headlines before sharing the presentation.
This is where an AI presentation maker earns its place. Paste in your summary notes (or upload the document you wrote them in), describe the audience, and ask for a structured deck. The tool gives you an outline, slide titles, body text and a starting design, which you then edit. You are not asking it to analyse your business. You’re asking it to do the layout and first-pass wording so you can spend your time on the parts that need a human.
Here’s a prompt I’ve used, lightly adapted:
Create a 12-slide quarterly business review for a mid-sized logistics client using our CRM platform. Audience: their VP of Operations and two team leads. Tone: direct, plain English, no marketing language. Structure: agenda, goals recap from last QBR, results against goals, support summary, adoption and usage, wins, open issues, roadmap for next quarter, our recommendations, what we need from you, next steps, appendix. Use the notes below. Do not invent any numbers.
Then paste the notes. The “do not invent any numbers” line matters. Generative tools will happily fill a gap with a plausible percentage if you leave one open, and a made-up stat in front of a client’s VP is the kind of mistake that follows you around.
A sample outline that works
A good first draft, before any editing, usually lands somewhere close to this. Your slide count will vary.
| Slide | Title | What goes on it |
| 1 | Q3 review: [Client] and [Your company] | Date, attendees, one-line purpose |
| 2 | What we agreed in Q2 | Three commitments, each marked done, partial or open |
| 3 | Results against goals | One chart, one headline number, one sentence of context |
| 4 | Support summary | Case volume trend, resolution time, notable escalations |
| 5 | Adoption | Active users or feature usage, compared with last quarter |
| 6 | Wins worth repeating | Two specific examples, with the team member who drove them |
| 7 | Open issues | Honest list, with owner and expected date |
| 8 | Next quarter’s plan | Three priorities, no more |
| 9 | Recommendations | What you’d change in how they use the product |
| 10 | What we need from you | The sticky-note item, stated plainly |
| 11 | Next steps | Owners and dates |
| 12 | Appendix | Detailed tables for anyone who wants them |
Notice there’s one chart on the results slide, not four. A QBR audience is usually a mix of people who live in the numbers and people who don’t, and the appendix is where the detailed tables belong.
Editing the draft: where your time should go
Once the AI has produced the draft, the work changes. You’re now an editor, and the edits fall into a few categories.
Check every figure against the source. Every single one. Open the CRM export next to the deck and tick them off. If the tool rephrased “average resolution time dropped from 31 hours to 19 hours” into “resolution time improved by nearly 40%,” confirm the maths (it’s about 39%, so fine) and decide whether the client would rather see the hours. Usually they would. Hours are concrete; percentages invite the question “of what?”
Rewrite the headlines. AI-generated slide titles tend toward labels: “Support Overview,” “Usage Metrics.” A good QBR title states the finding. Compare:
- Before: “Support Overview”
- After: “Ticket volume fell for the second quarter running, mostly in billing questions”
The second version means a busy VP can read only the titles and still get the gist. Try reading your deck titles in sequence, out loud. If they form a sensible paragraph, the deck is in decent shape.
Cut the filler bullets. Drafts often include three bullets where one would do. If a bullet could appear in any client’s deck (“Continued partnership and collaboration”), delete it.
Add the awkward slide. The open issues slide is the one teams most want to soften. Don’t. A client who sees you name the problem before they do will trust the rest of your numbers more. Keep it factual: what happened, what you’ve done, what’s still outstanding, who owns it.
Design choices for CRM data
Related walkthrough
SuiteCRM Chapter 8: GuestPostCRM Deep Dive | AI CRM Automation & Email Intelligence

Most CRM dashboards are built for people who look at them daily. Your QBR audience doesn’t. A few practical adjustments help:
Use one colour for “this quarter” and a muted grey for “last quarter” on every chart. Keep it consistent across slides so nobody has to re-read a legend. If your AI tool suggests a chart type, check it. Pie charts for six support categories are hard to read; a sorted horizontal bar chart is almost always clearer.
Put the client’s logo on the title slide and nowhere else. Logo-on-every-slide makes a deck feel like a template, which it is, but the client doesn’t need reminding.
Font size matters more than people expect, especially when the meeting is on a video call and somebody is viewing on a laptop with the deck shrunk to half the screen. Nothing below 18pt on body slides. If the content doesn’t fit at 18pt, there’s too much content.
A worked example: one slide, before and after
Here’s a real-world style example (details changed). An account manager’s notes said:
“Usage: 142 active users in Q3, up from 118 in Q2. Most growth from warehouse team after June training. Finance team still low, 6 users of 20 licences. Mobile app adoption low.”
The AI draft produced this slide:
Adoption Metrics – Active users increased to 142 – Strong growth across teams – Opportunities for further adoption – Mobile engagement can be improved
Every bullet is technically true and almost useless. “Strong growth across teams” is wrong, actually: growth came from one team. After editing:
Active users rose from 118 to 142, almost all from the warehouse team after June’s training – Warehouse: training worked, suggest the same session for finance – Finance: 6 of 20 licences in use – Mobile: low uptake, likely because the field team hasn’t been shown it
That version gives the client something to decide on (run finance training? show the mobile app to field staff?). It took about four minutes to rewrite. The AI saved the twenty minutes of layout, formatting and first-pass phrasing; the four minutes were the part only someone who knows the account could do.
Pulling it together faster next quarter
Once you’ve built one QBR deck this way, save three things: your prompt, your cleaned-up outline, and your editing checklist. Next quarter, you paste new notes into the same prompt, and a lot of the structure carries over. Some teams I’ve worked with keep a shared doc per account with the running list of commitments from each QBR, which makes slide 2 almost write itself.
If you manage several accounts, a reusable workflow looks something like this:
- Export CRM data for the account (same report each quarter, saved as a template in the CRM).
- Write the summary notes, about one paragraph per section.
- Run the saved prompt through your ai presentation maker with the new notes.
- Check figures, rewrite titles, cut filler, add the open issues slide.
- Send a PDF copy to the client a day ahead, keep the editable version for the meeting.
Sending the deck ahead is a good habit to pick up. People read it on their phone the night before and come in with questions already formed, which makes the meeting itself much shorter and much more useful. Some clients will also forward it to their own leadership, so make sure every slide makes sense without you narrating it.
Mistakes that keep showing up

A few patterns I see in AI-assisted QBR decks again and again:
Letting the tool decide the narrative: If you paste in raw notes with no stated goal, you’ll get a deck that summarises activity. Clients don’t buy activity. Tell the tool what the deck needs to prove.
Too many slides: Twelve is plenty for a one-hour meeting with discussion. If the draft comes back at twenty, merge or move things to the appendix.
Generic recommendations: “Increase user adoption” is not a recommendation. “Run a 45-minute session for the finance team on invoice approvals, which is the workflow they’re still doing in spreadsheets” is one.
Forgetting the internal pre-read: If your manager or a solutions engineer is joining the call, send them the deck first. Nothing derails a QBR faster than a colleague contradicting a slide in front of the client.
Copying last quarter’s design without checking it: Old logos, outdated product names, last year’s pricing on the appendix slide. It happens. Click through every slide once in presentation mode before sending.
Before you hit send
Read only the slide titles, in order. Then read only the “what we need from you” slide. If a stranger could understand the quarter from those two passes, and the request on that slide is specific enough that the client can say yes or no in the meeting, you’re ready. If not, go back to the sticky note you wrote at the start and see which of the three items got lost along the way.
An effective quarterly business review deck combines accurate data, a clear narrative, and specific next steps. AI can accelerate the drafting and formatting process, but the final presentation should reflect your understanding of the account and the client’s priorities. By reusing a consistent structure and validating every insight, you can build more useful QBR presentations with less manual effort each quarter.
Frequently Asked Questions
Check your company’s policy and your contract with the client first. Many teams anonymise or summarise before pasting (writing “Client A” instead of the company name, rounding figures where precision isn’t needed), then add specifics back in during editing.
Both. Present from the editable file so you can fix a typo live; send a PDF beforehand and afterward so formatting doesn’t break on the client’s machine.
It depends on how clean your CRM data is. When notes are ready, the drafting step is quick, and most of your time goes into checking numbers and rewriting titles, which is where it should go.